
What's the meaning of RDW, HCT, MCH, MCHC ? Is it measured or calculated?
we will now try to explain the meaning of these parameters and how is it measured or calculated
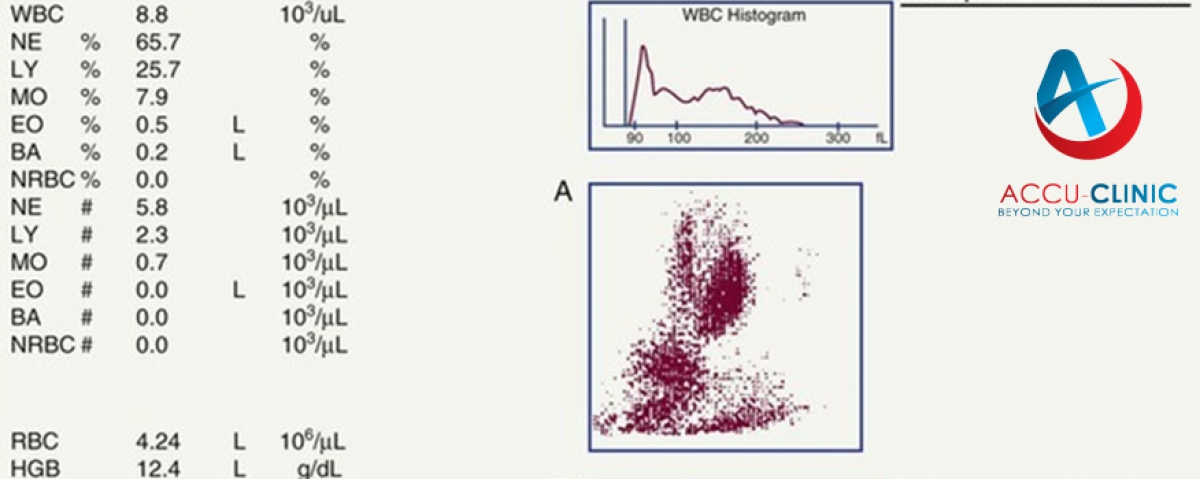
Erythrocyte Count
Up to 20 years ago, blood cellswere counted “by hand” in an optical counting chamber. Thismethod has now been almost completely abandoned in favor of automated counters that determine the number of erythrocytes by measuring the impedance or light dispersion of EDTA blood (1 ml), or heparinized capillary blood. Due to differences in the hematocrit, the value froma sample taken after (at least 15minutes’) standing or physical activity will be 5–10% higher than the value from a sample taken after 15 minutes’ bed rest.
Hemoglobin (HB) and Hematocrit (HCT) Assay
Hemoglobin is oxidized to cyanmethemoglobin by the addition of cyanide, and the cyanmethemoglobin is then determined spectrophotometrically by the automated counter. The hematocrit describes the ratio of the volume of erythrocytes to the total blood volume (the SI unit is
without dimension, e.g., 0.4). The EDTA blood is centrifuged in a disposable capillary tube for 10
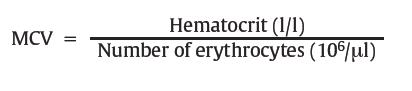
minutes using a high-speed microhematocrit centrifuge (reference method). The automated hematology counter determines the mean corpuscular or cell volume (MCV,measured in femtoliters, fl) and the number of erythrocytes. It calculates the hematocrit (HCT) using the following
formula:
HCT =MCV (fl) × number of erythrocytes (106/μl).
Calculation of Erythrocyte Parameters
The quality of erythrocytes is characterized by their MCV, their mean cell hemoglobin content (MCH), and the mean cellular hemoglobin concentration (MCHC).
MCV is measured directly using an automated hemoglobin analyzer, or is calculated as follows:
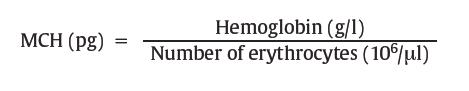
MCH (in picograms per erythrocyte) is calculated using the following formula:
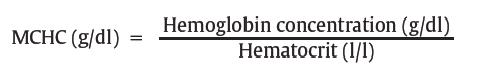
MCHC is determined using this formula:
Red Cell Distribution Width (RDW)
Modern analyzers also record the red cell distribution width (cell volume distribution). In normal erythrocyte morphology, this correlates with the Price-Jones curve for the cell diameter distribution. Discrepancies are used diagnostically and indicate the presence of microspherocytes (smaller cells with lighter central pallor).
continued ...