In 1981, Dr. James Westgard of the University of Wisconsin published an article on laboratory quality control that set the basis for evaluating analytical run quality for medical laboratories. The elements of the Westgard system are based on principles of statistical process control used in industry nationwide since the 1950s.10 There are six basic rules in the Westgard scheme. These rules are used individually or in combination to evaluate the quality of analytical runs.
Westgard devised a shorthand notation for expressing quality control rules. Most of the quality control rules can be expressed as NL where N represents the number of control observations to be evaluated and L represents the statistical limit for evaluating the control observations. Thus 13s represents a control rule that is violated when one control observation exceeds the ±3s control limits.
- 1:2s rule
This is a warning rule that is violated when a single control observation is outside the ±2s limits. Remember that in the absence of added analytical error, about 4.5% of all quality control results will fall between the 2s and 3s limits. This rule merely warns that random error or systematic error may be present in the test system. The relationship between this value and other control results within the current and previous analytical runs must be examined. If no relationship can be found and no source of error can be identified, it must be assumed that a single control value outside the ±2s limits is an acceptable random error. Patient results can be reported.
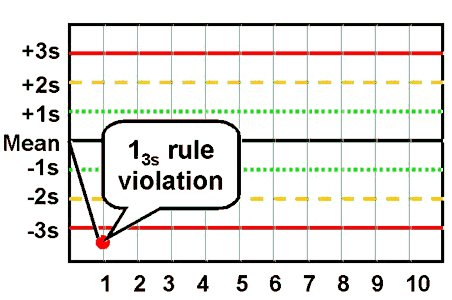
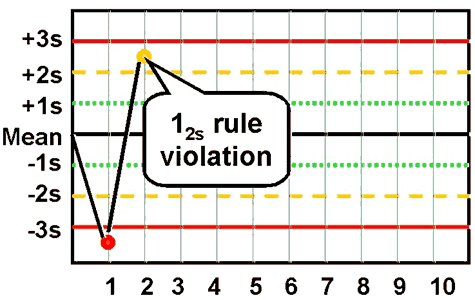
- 1:3s rule
This rule identifies unacceptable random error or possibly the beginning of a large systematic error. Any QC result outside ±3s violates this rule A run is rejected when a single control measurement exceeds the mean plus 3s or the mean minus 3s control limit.
- 1:2s rule
refers to the control rule that is commonly used with a Levey-Jennings chart when the control limits are set as the mean plus/minus 2s. In the original Westgard multirule QC procedure, this rule is used as a warning rule to trigger careful inspection of the control data by the following rejection rules.
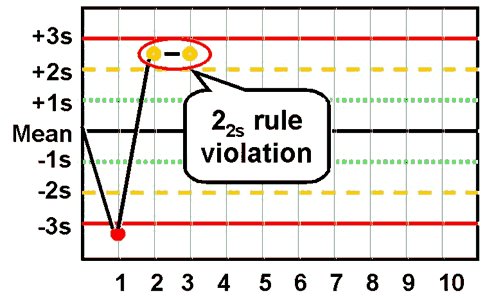
- 2:2s rule
This rule identifies systematic error only.
The criteria for violation of this rule are:
•• Two consecutive QC results
•• Greater than 2s
•• On the same side of the mean
There are two applications to this rule: within-run and across runs. The within-run application affects all control results obtained for the current analytical run.
For example, if a normal (Level I) and abnormal (Level II) control are assayed in this run and both levels of control are greater than 2s on the same side of the mean, this run violates the within-run application for systematic error. If however, Level I is -1s and Level II is +2.5s (a violation of the 12s rule), the Level II result from the previous run must be examined. If Level II in the previous run was at +2.0s or greater, then the across run application for systematic error is violated.
Violation of the within-run application indicates that systematic error is present and that it affects
potentially the entire analytical curve. Violation of the across run application indicates that only a single portion of the analytical curve is affected by the error.
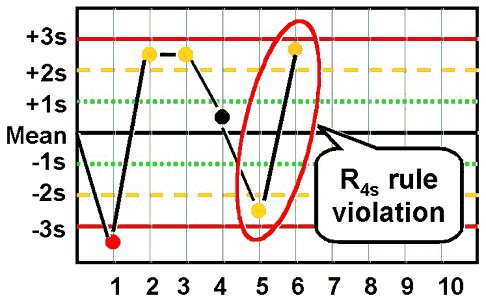
- R4s
This rule identifies random error only, and is applied only within the current run. If there is at least a 4s difference between control values within a single run, the rule is violated for random error.
For example,
assume both Level I and Level II have been assayed within the current run. Level I is +2.8s above the mean and Level II is -1.3s below the mean. The total difference between the two control levels is greater than 4s (e.g. [+2.8s – (-1.3s)] = 4.1s).
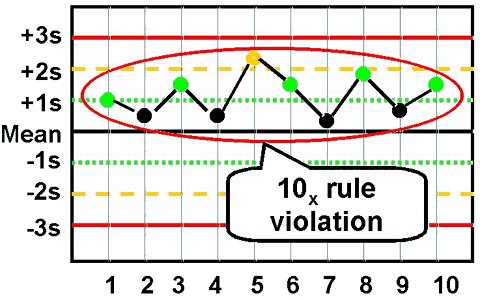
- Rules 7X, 8X, 9X, 10X,12X
These rules are violated when there are:
•7 or 8, or 9, or 10, or 12 control results
• On the same side of the mean regardless of
the specific standard deviation in which they are located.
Each of these rules also has two applications:
within control material (e.g., all Level I control results) or across control materials (e.g. Level I, II,
and III control results in combination). Within control material violations indicate systematic bias in a
single area of the method curve while violation of the across control materials application indicates
systematic bias over a broader concentration.